Scientific Diagrams
The following diagrams are not organized in any particular order. At some point, when I have several linked, I’ll organize them by categories.
- Soares et al. 2022
Islands are becoming taxonomically and functionally more similar after losing unique bird species and gaining common widespread birds.
- Pilowsky et al. 2022
Modeling the mechanisms that govern the structure and dynamics of biodiversity.
- Riva & Nielsen 2020
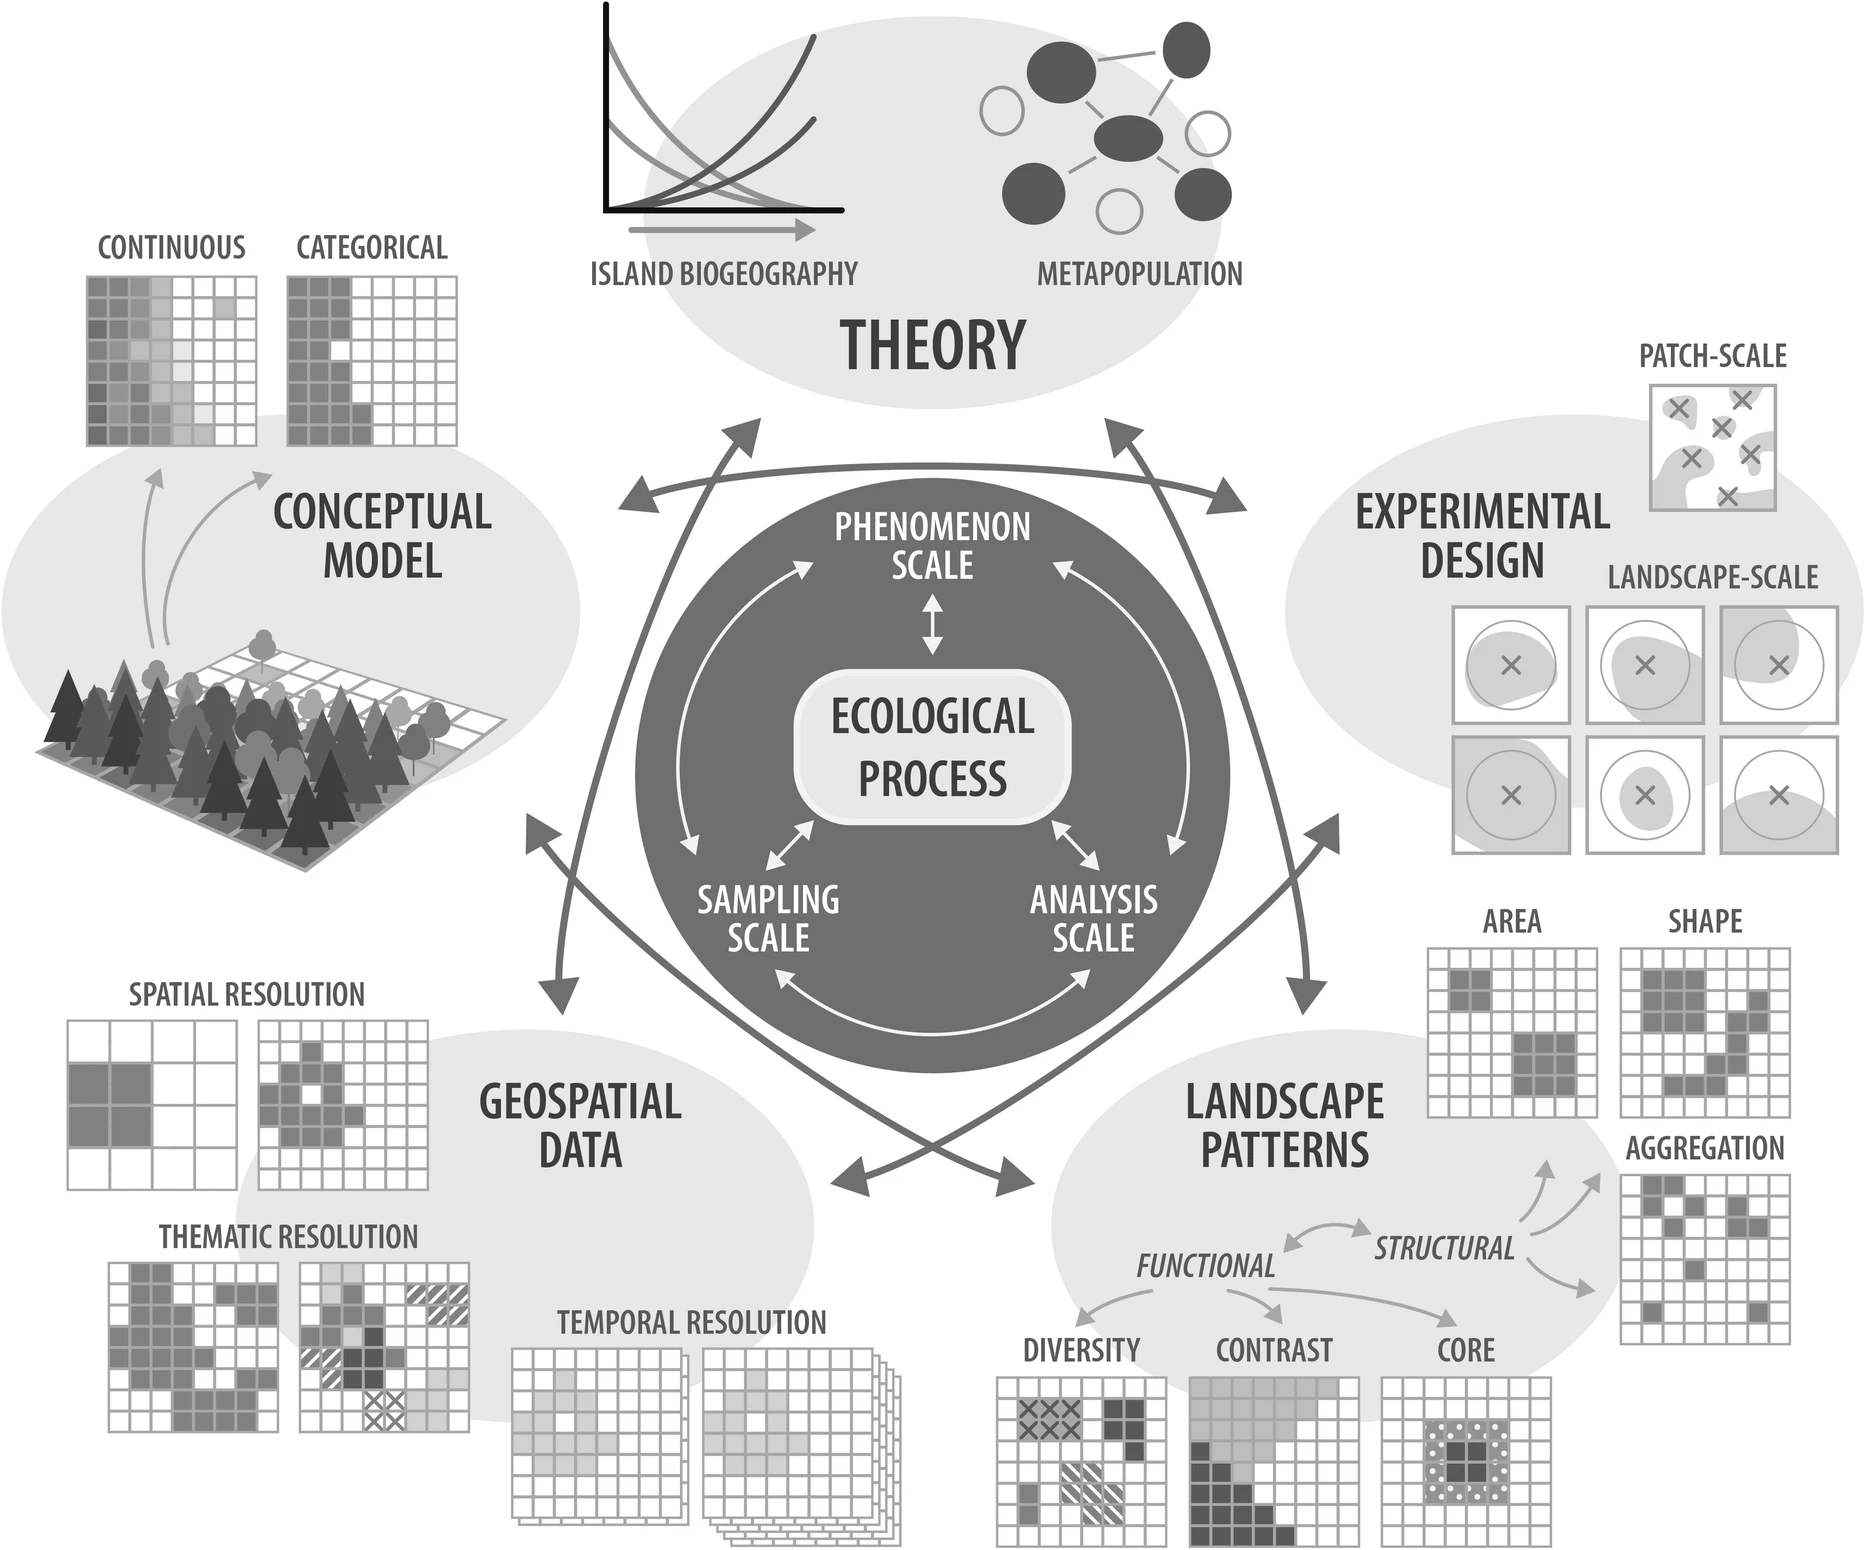
Six key steps for functional landscape analyses of habitat change
- Broadley et al. 2019
Space use is one factor affecting detections on CTs. Here, two aspects of space use are considered: home-range size and movement rate.
- Naves-Alegre et al. 2022
Results of the spatial and spatio-temporal co-occurrence analyses between pairs of species, both qualitative co-occurrence and quantitative GLMs (spatial co-occurrence) and GLMMs (spatio-temporal co-occurrence) that relate the abundances of the species.
- Rodrigues et al. 2022
Synthesis of the observed impacts of land-use transition on mean annual evapotranspiration (ET) and average land surface temperature (LST) in the Cerrado.
- Palmer et al. 2022
Dynamic landscapes of fear: understanding spatiotemporal risk.
- Grames, Schwartz, Elphick. 2022.
Conceptual flowchart of a systematic process to develop conceptual models of alternative hypotheses in which (a) the scope of the research question is formally defined, (b) a systematic review is conducted, (c) researchers extract authors’ hypotheses as implied causal relationships that are (d) merged into a graphical model that can be (e) analysed to identify trends in scientific thinking.
- Magle & Fidino 2018.
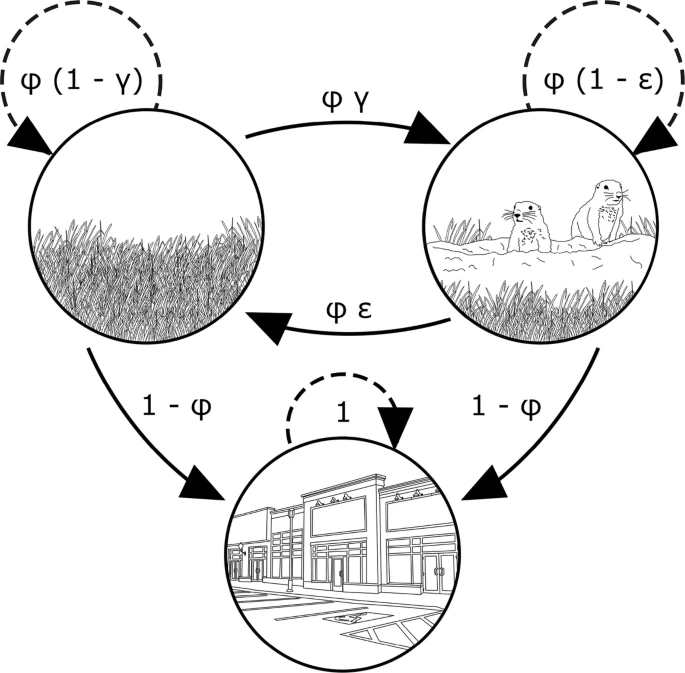
Transition probabilities between the three possible states a habitat fragment could transition between from 1 year to the next.
- Suraci et al. 2022
Beyond spatial overlap: harnessing new technologies to resolve the complexities of predator–prey interactions.
- Gamez & Harris 2022
Conceptual diagram of a vertical forest ecosystem.
- Siren et al. 2022.
Forecasting species distributions: Correlation does not equal causation.
- Ford & Goheen. 2015.
Conceptual Framework for Evaluating Alternative Hypotheses for a Three-Level Trophic Cascade Involving a Large Carnivore, its Herbivorous Prey, and Plants.


